Process, analyze and report your LC-MS and GC-MS data from your different instruments
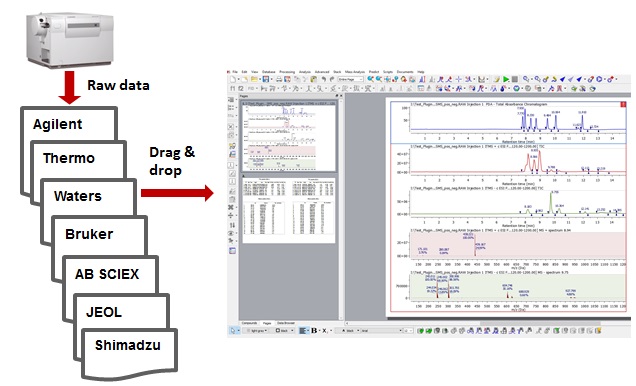
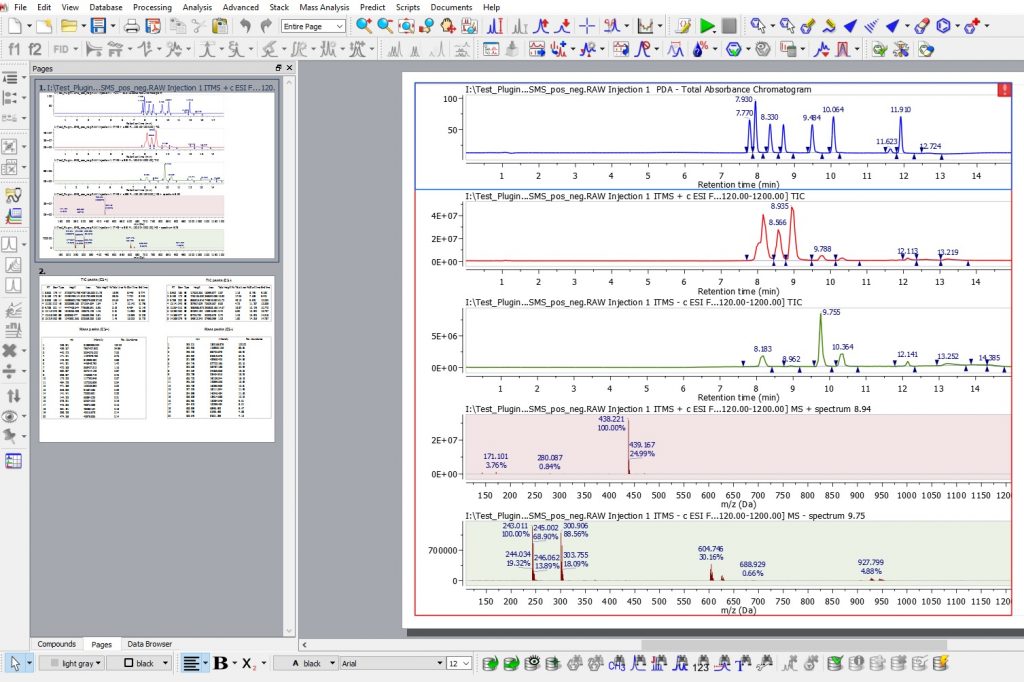
Provides a common interface for different vendor data and automates all functionality such as data importing and display, integration, background subtraction, display of extracted mass chromatograms, molecule match, enumeration of molecular formulae, etc.

Process and report your MS data on your desktop!
Mnova MS: 45-day FREEÂ trial
 Â 1. Download
 1. Download
Download Mnova for a suitable Operating System (below). No extra installer is required.
 2. Installation
Open Mnova and go to ‘Help/Get-Install Licenses’. Select ‘Evaluate’.
 3. License
Fill in the form to receive your trial license via e-mail.
Help & Resources
MS
New videos
MS
Highlights
Opens the power of the technique to all non-expert users.
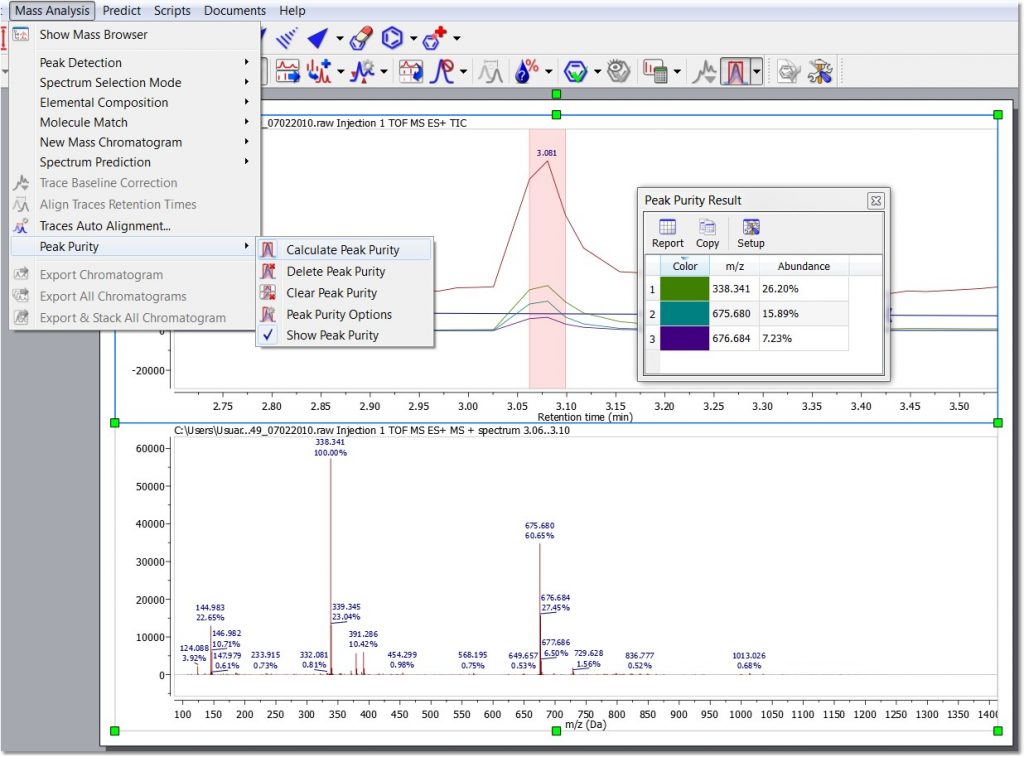
Calculating MS peak purity.Â
MS
Features
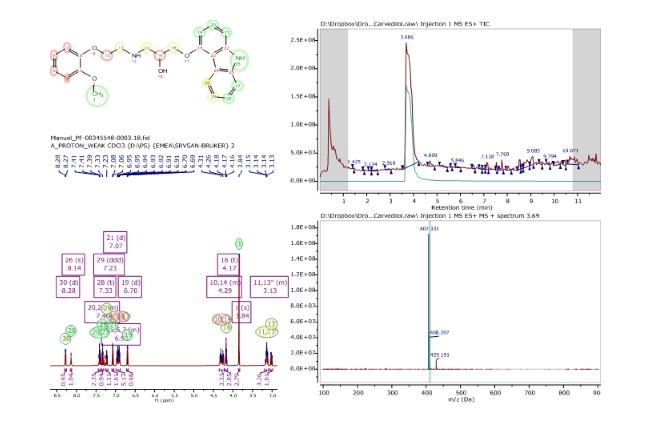
Combine NMR and LC-MS or GC-MS data in the same document
Open automatically your analytical data from instruments such as Agilent, Bruker, JEOL, Thermo, and Waters as well as data in mzData or mzXML formats (see supported formats here).
Integrate peaks in the TIC, MS, and UV/ELSD traces (automatically or manually).
Select mass spectra based on TIC peaks, with or without background subtraction and display them in centroid or profile mode.
You can also co-add mass spectra manually as well as open NMR and MS data in the same document and analyze and report them together.
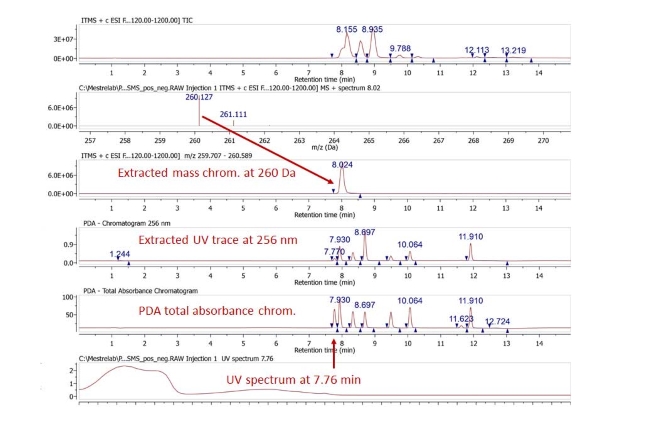
Easily generate EMC/EIC, UV traces and UV spectra
Generate Extracted Mass/Ion Chromatograms (EMC/EIC) for a given mass range or a certain m/z value.
You can also generate UV Traces at a given wavelength from a DAD trace.
It is very simple to extract UV spectra at selected retention times from a PDA total absorbance chromatogram.
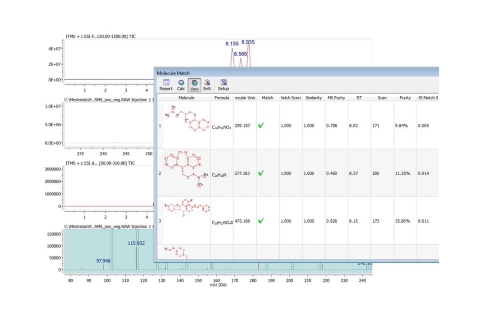
Automatic molecule matching for structure confirmation
In addition to its many tools for structure confirmation by NMR, implemented in the NMR plugin, molecular match is a useful tool for structure confirmation by LC/GC/MS in Mnova MS.
This functionality is extremely fast and easy to use, making this capability available to all users, even complete novices.
Import chemical structures and let the software confirm which ones match your experimental data. The match criteria can be customized by selecting the adducts and losses, mass accuracy and score thresholds, etc.
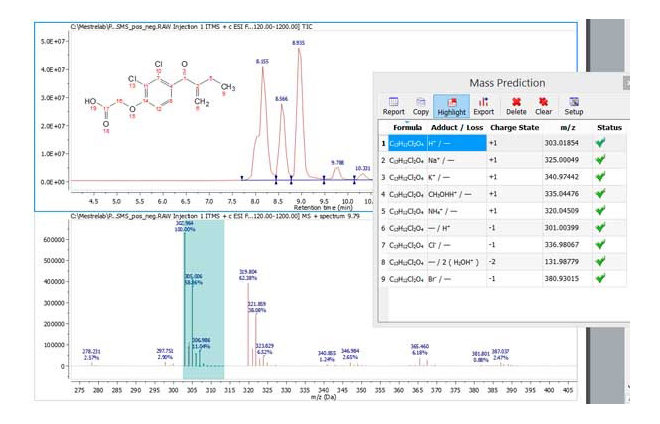
Predicting isotope clusters with various adducts and losses for verification of elemental compositions.
The feature allows the user to propose one or multiple molecular formulae and predict their mass peaks with all pre-defined list of adducts or losses.
Mnova MS predicts a list of molecular ion and isotopic peaks, and automatically matches the predicted peaks with the experimental peaks (if available).
You can choose which prediction (with desired adduct or loss) to display on the spectrum for comparison.
Mnova MS users
Market
- Teaching MS to chemistry departments
- Research in organic, medicinal and environmental chemistry
- Quality control in chemical and pharmaceutical companies
Frequently Asked Questions
FAQs
How can I know if my data is compatible with Mnova?
Mnova MS supports most of the different MS data formats. You can check it on the MS supported format table here. Please let us know if your MS data format is not in the list.
How much does the MS module cost?
You can find the cost of this module in our online store. You can also check out for any combo option if you have or you need Mnova NMR. For any questions about pricing you can always contact us directly at sales@mestrelab.com
I have Mnova NMR and I am wondering if I could add my MS data to my NMR reports.
Yes. You can open NMR and MS data in the same document, and cut/paste the MS display to the same page of NMR data if needed. Or you can create a display template to automatically format the reports.
Can I use my MS data for verification purposes?
Yes. Run Molecule Match in Mnova MS to verify the elemental composition automatically, or run Mnova Verify to verify a proposed structure against your MS data (Mnova Verify needs a separate license).
Can I use it to process my High Resolution MS data?
Yes. Both high resolution and low resolution MS data can be used by Mnova MS. Just make sure you set the proper mass tolerance parameters when you do Molecular Match.
Can I try Mnova MS?
Yes, you can download a 45-day trial license of any of our products. The Mnova MS module is included within the main Mnova installer. Download Mnova and try it now!
Success Stories
Case Studies
Automated analysis and reporting LC/MS and NMR together for compound registration – A case study
A pharma company does quality control of their compounds using both NMR and LC/MS before registration, and generates the analysis reports in their own format. Based on their requirement, we developed a Mnova script (R_NMR_MS.qs) that does all of this automatically. Read More